The Entrepreneur Forum | Financial Freedom | Starting a Business | Motivation | Money | Success

Welcome to the only entrepreneur forum dedicated to building life-changing wealth.

Build a Fastlane business. Earn real financial freedom. Join free.

Join over 80,000 entrepreneurs who have rejected the paradigm of mediocrity and said "NO!" to underpaid jobs, ascetic frugality, and suffocating savings rituals— learn how to build a Fastlane business that pays both freedom and lifestyle affluence.

Free registration at the forum removes this block.

CHART OF THE WEEK: Mapped, Countries With the Highest Housing Bubble Risks

MetalGear

Gold Contributor
FASTLANE INSIDER
Read Fastlane!
Read Unscripted!
Summit Attendee
Speedway Pass
User Power
Value/Post Ratio
258%
Jan 24, 2017
605
1,562
Narnia

Mapped: The Countries With the Highest Housing Bubble Risks

Mapped: The Countries With the Highest Housing Bubble Risks


Mapped: Countries With the Highest Housing Bubble Risks
With a decade-long bull market and an ultra low interest rate environment globally, it’s not surprising to see capital flock to housing assets.

For many investors, real estate is considered as good of a place as any to park money—but what happens when things get a little too frothy, and the fundamentals begin to slip away?
In recent years, experts have been closely watching several indicators that point to rising bubble risks in some housing markets. Further, they are also warning that countries like Canada and New Zealand may be overdue for a correction in housing prices.

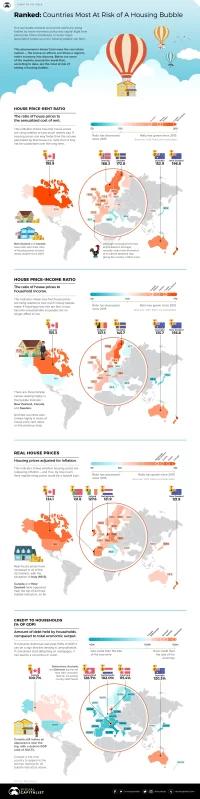
Key Housing Market Indicators
Earlier this week, Bloomberg published results from a new study by economist Niraj Shah as he aimed to build a housing bubble dashboard.
It tracks four key metrics:
  1. House Price-Rent Ratio
    The ratio of house prices to the annualized cost of rent
  2. House Price-Income Ratio
    The ratio of house prices to household income
  3. Real House Prices
    Housing prices adjusted for inflation
  4. Credit to Households (% of GDP)
    Amount of debt held by households, compared to total economic output
Ranking high on just one of these metrics is a warning sign for a country’s housing market, while ranking high on multiple measures signals even greater fragility.

Housing Bubble Risks, by Indicator
Let’s look at each bubble risk indicator, and see how they apply to the 22 countries covered by the housing dashboard.
It should be noted that most of the measures here are shown in an index form, using the year 2015 as a base year. In other words, the data is not representative of the ratio itself—but instead, how much the ratio has risen or fallen since 2015.

1. House Price-Rent Ratio
When looking at housing prices in comparison to rents, there are four countries that stand out.
New Zealand (196.8) and Canada (195.9) have seen ratios of housing prices to rents nearly double since 2015. Meanwhile, Sweden (172.8) and Norway (168.2) are not far behind.
Elsewhere in the world, this ratio is much more in line with expectations. For example, in Portugal—where house prices have skyrocketed over recent years—rents have increased at nearly the same rate, giving the country a 99.2 score.

2. House Price-Income Ratio
There are three familiar names at the top of this bubble indicator: New Zealand (156.8), Canada (155.3), and Sweden (145.7).
In places where rents are lagging housing prices, so are the levels of household income. For how long will people afford to buy increasingly expensive houses, if their incomes continue to lag?
3. Real House Prices

Real house prices have increased in all of the 22 markets, with the exception of Italy (95.5).
For this indicator, there are five markets that stand out as having fast-rising prices: Portugal (131.8), Ireland (127.6), Netherlands (121.9), Canada (124.1), and New Zealand (121.9). The latter two (Canada/New Zealand) have appeared near the top of all three bubble indicators, so far.

4. Credit to Households (% of GDP)
Exceedingly high debt ratios point to a strain on consumer finances – and when finances are strained, the chance of a default increases.
Switzerland (128.7%), Australia (120.3%), and Denmark (115.4%) top the list here with consumer debt far exceeding country GDP levels. However, Canada still makes an appearance in the top five with a debt-to-GDP ratio of 100.7%.

https://www.visualcapitalist.com/subscribe
 
Dislike ads? Remove them and support the forum: Subscribe to Fastlane Insiders.

Attachments

  • 1563713684864.png
    1563713684864.png
    2.8 MB · Views: 14

MJ DeMarco

I followed the science; all I found was money.
Staff member
FASTLANE INSIDER
EPIC CONTRIBUTOR
Read Rat-Race Escape!
Read Fastlane!
Read Unscripted!
Summit Attendee
Speedway Pass
User Power
Value/Post Ratio
446%
Jul 23, 2007
38,155
170,209
Utah
Wow, I knew Canada was bad, but not that bad!

Been waiting for real estate to go on sale for 5+ years.
 

MetalGear

Gold Contributor
FASTLANE INSIDER
Read Fastlane!
Read Unscripted!
Summit Attendee
Speedway Pass
User Power
Value/Post Ratio
258%
Jan 24, 2017
605
1,562
Narnia

TheCj

Bronze Contributor
Read Fastlane!
Read Unscripted!
Speedway Pass
User Power
Value/Post Ratio
191%
Jan 3, 2017
223
425
Ontario, Canada
It is interesting to see the similarities in Canada, Australia, and the Scandinavian countries that are showing up. All large physical land mass area's with very small pockets of actual cities. So the demand is so high in the livable large cities even though there is such an abundance of physical space.
Just heard on the radio Toronto has 120 cranes in the city, dwarfing New York that has somewhere in the 20's range.
Quote from Grant Cardone "Cranes in the sky, don't buy", also the rent where you live and buy what you rent out or something along those lines, comes to mind.
 

AgainstAllOdds

Legendary Contributor
EPIC CONTRIBUTOR
Read Fastlane!
Speedway Pass
User Power
Value/Post Ratio
647%
Dec 26, 2014
2,274
14,724
32
Chicago, IL
Interesting, but how much of this is a result of foreign investment throwing off the metrics?

I know Canadian real estate used to be the easiest place for Chinese money to be parked. Same way that Miami used to get illicit investment, but still maintains high prices.

In any market, if you increase true demand by 10%, the price shoots up. It's hard to tell if that isn't just that.
 

MetalGear

Gold Contributor
FASTLANE INSIDER
Read Fastlane!
Read Unscripted!
Summit Attendee
Speedway Pass
User Power
Value/Post Ratio
258%
Jan 24, 2017
605
1,562
Narnia
Interesting, but how much of this is a result of foreign investment throwing off the metrics?

I know Canadian real estate used to be the easiest place for Chinese money to be parked. Same way that Miami used to get illicit investment, but still maintains high prices.

In any market, if you increase true demand by 10%, the price shoots up. It's hard to tell if that isn't just that.

Definitely a factor, hard to tell unless there is an open data set somewhere.
 
Dislike ads? Remove them and support the forum: Subscribe to Fastlane Insiders.

Timmy C

I Will Not Stop!
EPIC CONTRIBUTOR
Read Fastlane!
Read Unscripted!
Speedway Pass
User Power
Value/Post Ratio
231%
Jun 12, 2018
2,921
6,735
Melbourne, Australia
I can't believe Australia hasn't fallen of a cliff yet to be honest.
 

ZF Lee

Legendary Contributor
FASTLANE INSIDER
EPIC CONTRIBUTOR
Read Rat-Race Escape!
Read Fastlane!
Read Unscripted!
Speedway Pass
User Power
Value/Post Ratio
180%
Jul 27, 2016
2,860
5,141
25
Malaysia
Interesting, but how much of this is a result of foreign investment throwing off the metrics?

I know Canadian real estate used to be the easiest place for Chinese money to be parked. Same way that Miami used to get illicit investment, but still maintains high prices.

In any market, if you increase true demand by 10%, the price shoots up. It's hard to tell if that isn't just that.
Speaking of the Chinese, I'm surprised Hong Kong isn't on the list.

On a side note though, I'm surprised no one on TFLF is discussing what's going on in HK now, economically (and a little politically)
 

flower_girl

Contributor
User Power
Value/Post Ratio
189%
Jul 9, 2019
28
53
House and property prices in NZ are insane.

I think we're at a point in some areas now though where sales have slowed markedly because everyone knows there is probably a correction coming and no one wants to be the one left holding a house or property which has dropped in value.
 
Dislike ads? Remove them and support the forum: Subscribe to Fastlane Insiders.

AgainstAllOdds

Legendary Contributor
EPIC CONTRIBUTOR
Read Fastlane!
Speedway Pass
User Power
Value/Post Ratio
647%
Dec 26, 2014
2,274
14,724
32
Chicago, IL
Speaking of the Chinese, I'm surprised Hong Kong isn't on the list.

It won't be.

You need to understand how HK works. It's not like American real estate.

A lot of their tax revenue comes from selling vacant lots to developers, so it's in the government's best interest to maintain a limited supply of new development lots and an artificially high real estate price.

25994

Look at that chart. 20% of the revenue comes from "Land Premium" in the past few years.

25995

Here's a breakdown of what that is.

Essentially, you have a government that makes sure demand always exceeds supply by creating an artificial scarcity of real estate.

Next, it uses those tax profits to subsidize housing for the half of the country. "48.8% of Hong Kong is subsidized housing": Public housing in Hong Kong - Wikipedia.

The subsidized housing allows them to maintain real estate prices without upsetting the local populace and causing a massive sell off.

Half of Hong Kong is cheap housing supported by the government.

The other half is the manipulated half that you and I see when we visit Hong Kong as tourists or expats - paying $3,000 a month for a room in Hong Kong Island.

@ZF Lee - a concern for you should be KL instead, where from my understanding Chinese investment owns a huge percentage of the central business districts.
 

ddzc

Gold Contributor
Speedway Pass
User Power
Value/Post Ratio
216%
May 22, 2012
577
1,247
Toronto
Interesting, but how much of this is a result of foreign investment throwing off the metrics?

I know Canadian real estate used to be the easiest place for Chinese money to be parked. Same way that Miami used to get illicit investment, but still maintains high prices.

In any market, if you increase true demand by 10%, the price shoots up. It's hard to tell if that isn't just that.

Exactly. These statistics and fancy graphs mean jack.

I've been in the RE game in Toronto for quite some time and have been seeing it all unfold before my eyes, and continues to do so. Our market is one of the strongest in the world, which attracts many investors. I can tell you, our real estate is still hot (I'm always on the lookout to buy), those hundreds of towers building condos are mostly sold out projects. Single family homes don't stay on the market long. We're even seeing bidding wars at times, similar to the likes from 2017. Chinese/HK investors, along with investors from other parts of the world (Middle East) are eating up the market. The locals here aren't buying because they simply have been outbid by foreigners. To buy a small 1bed+den in Toronto, you're looking at 650K-700K. 2bdr condos are starting at arund 800-850K. For a small beat up old bungalow around Toronto in ghetto pockets and neighborhoods are selling for +1M. Locals simply don't have the 20% down payment to get into the market.

The resale and rental market have both gone up in parallel. Back in 2014, I had my 2bd condo in Toronto rented for $1800. I lived in it from 2015-2017. In 2017, I rented it again for $2250 and in 2018, I rented it for $2550.

1. House Price-Rent Ratio - I've seen rent go up equally as much as the resale of properties (percentage wise), but it's pretty close. In my case, my unit has gone up 35%, while rent has gone up 30%.

2. House Price-Income Ratio - Totally skewed. The average family is not buying property in Toronto, it's mostly driven by foreign investors. The only locals buying are the ones who bought 15+ years ago and are selling, profiting, and then dumping that capital in to an upgrade, or cashing in and downgrading if they're nearing retirement.

3. Real House Prices - True

4. Credit to Households (% of GDP) - Partially true. We have very tight lending rules and typically require CMHC insurance unless 20% is put down. We also add stress tests on top of the mortgage value, so you need to qualify for an even bigger loan.

When there's mayhem or a need to park safe money, investors look to Vancouver and Toronto. I don't blame them. Just published 4 days ago - Hong Kongers are looking to buy properties in Toronto and Vancouver as protests rage

Back in 2017, we had bidding wars on all condos and resale homes in Toronto and the GTA. The Government had to step in to slow it down, it was literally out of control. I remember units were being sold over a single one minute phone call from overseas, without even looking at them in person. Homes were being sold without the buyers even present, no inspections, nothing. The government added a few new policies which included a 15% foreign investors tax and it definitely popped the bubble and made prices stagnant for a good year but it's been slowly and steadily crawling back up (not to those same levels). In addition, our currency is so weak, a 1M house is really a $750K USD bargain. If you're bring EU, pounds or USD in to our country, the exchange is the cherry on top.

IMO, our market has been very healthy and it's no wonder foreign investors love to park money down here. Will the bubble pop to a disastrous level? I doubt it, but you never know. I wish I could predict. Even in 2017, I would call that a mild pop, because prices still remained high and much higher than 2014-2016 prices. I don't know a single person who owns real estate from back in 2014-2015 and doesn't cash flow positive off of their rent, or made hundreds of thousands of dollars in real estate alone. We have a large amount of immigrants moving to Toronto on a yearly basis, and a lot of them come with a ton of money, buying million dollar homes with cash. As long as we have those flocks of immigrants and foreign investors, prices will just keep inflating, and I don't see those factors slowing down one bit, instead will just be ramping up more and more.
 
Dislike ads? Remove them and support the forum: Subscribe to Fastlane Insiders.

Post New Topic

Please SEARCH before posting.
Please select the BEST category.

Post new topic

Guest post submissions offered HERE.

New Topics

Fastlane Insiders

View the forum AD FREE.
Private, unindexed content
Detailed process/execution threads
Ideas needing execution, more!

Join Fastlane Insiders.

Top